- Avalanche’s cumulative daily transaction record increased by 1,507% as compared to 2021
- The price of AVAX witnessed a divergence from the uptrend in transaction volume
Despite being in the midst of a crypto winter, Avalanche [AVAX] seems to be doing pretty well for itself. On 21 November, the Avalanche network tweeted that it marked a significant increase in a certain important statistic. What effect will this tremendous expansion have on AVAX?
Avalanche broke 450 million total transactions today!
Exactly a year ago, Avalanche processed nearly 28 million total transactions.
Total transactions increased by 1,507% on Avalanche from November 2021 to November 2022. pic.twitter.com/BsXZW1MSvo
— Avalanche 🔺 (@avalancheavax) November 21, 2022
Read Avalanche [AVAX]’s Price Prediction 2022-2023
Avalanche witnesses a boost in…
In the tweet, Avalanche revealed that it had processed over 450 million transactions. The company disclosed that it had handled only 28 million transactions on 21 November last year. Thus, compared to the previous year, the total number of transactions on the network had increased by over 1,500%. The daily cumulative transaction record was smashed, and as could be seen from the graph, the measure had been trending upward.
According to Avalanche’s statistics, the network’s daily and monthly user bases witnessed significant growth over the previous year. Furthermore, despite a noticeable drop in recent months, the number still stood greater than what was available as of 2021.
The network’s NFT volume and count were indicators that additionally showed a respectable level of activity. According to Santiment, an examination of these NFT statistics revealed that the network experienced a respectable volume of NFT transactions.
Although the volume and count were $395,000 and 5 at the time of writing, respectively, they were much lower than the over $1 million and over 16 that were observed earlier in the month.
Source: Santiment
The increased daily transaction volume could be attributed to the recent uptick in user enthusiasm for NFTs on the network.
But volume and price take a hit
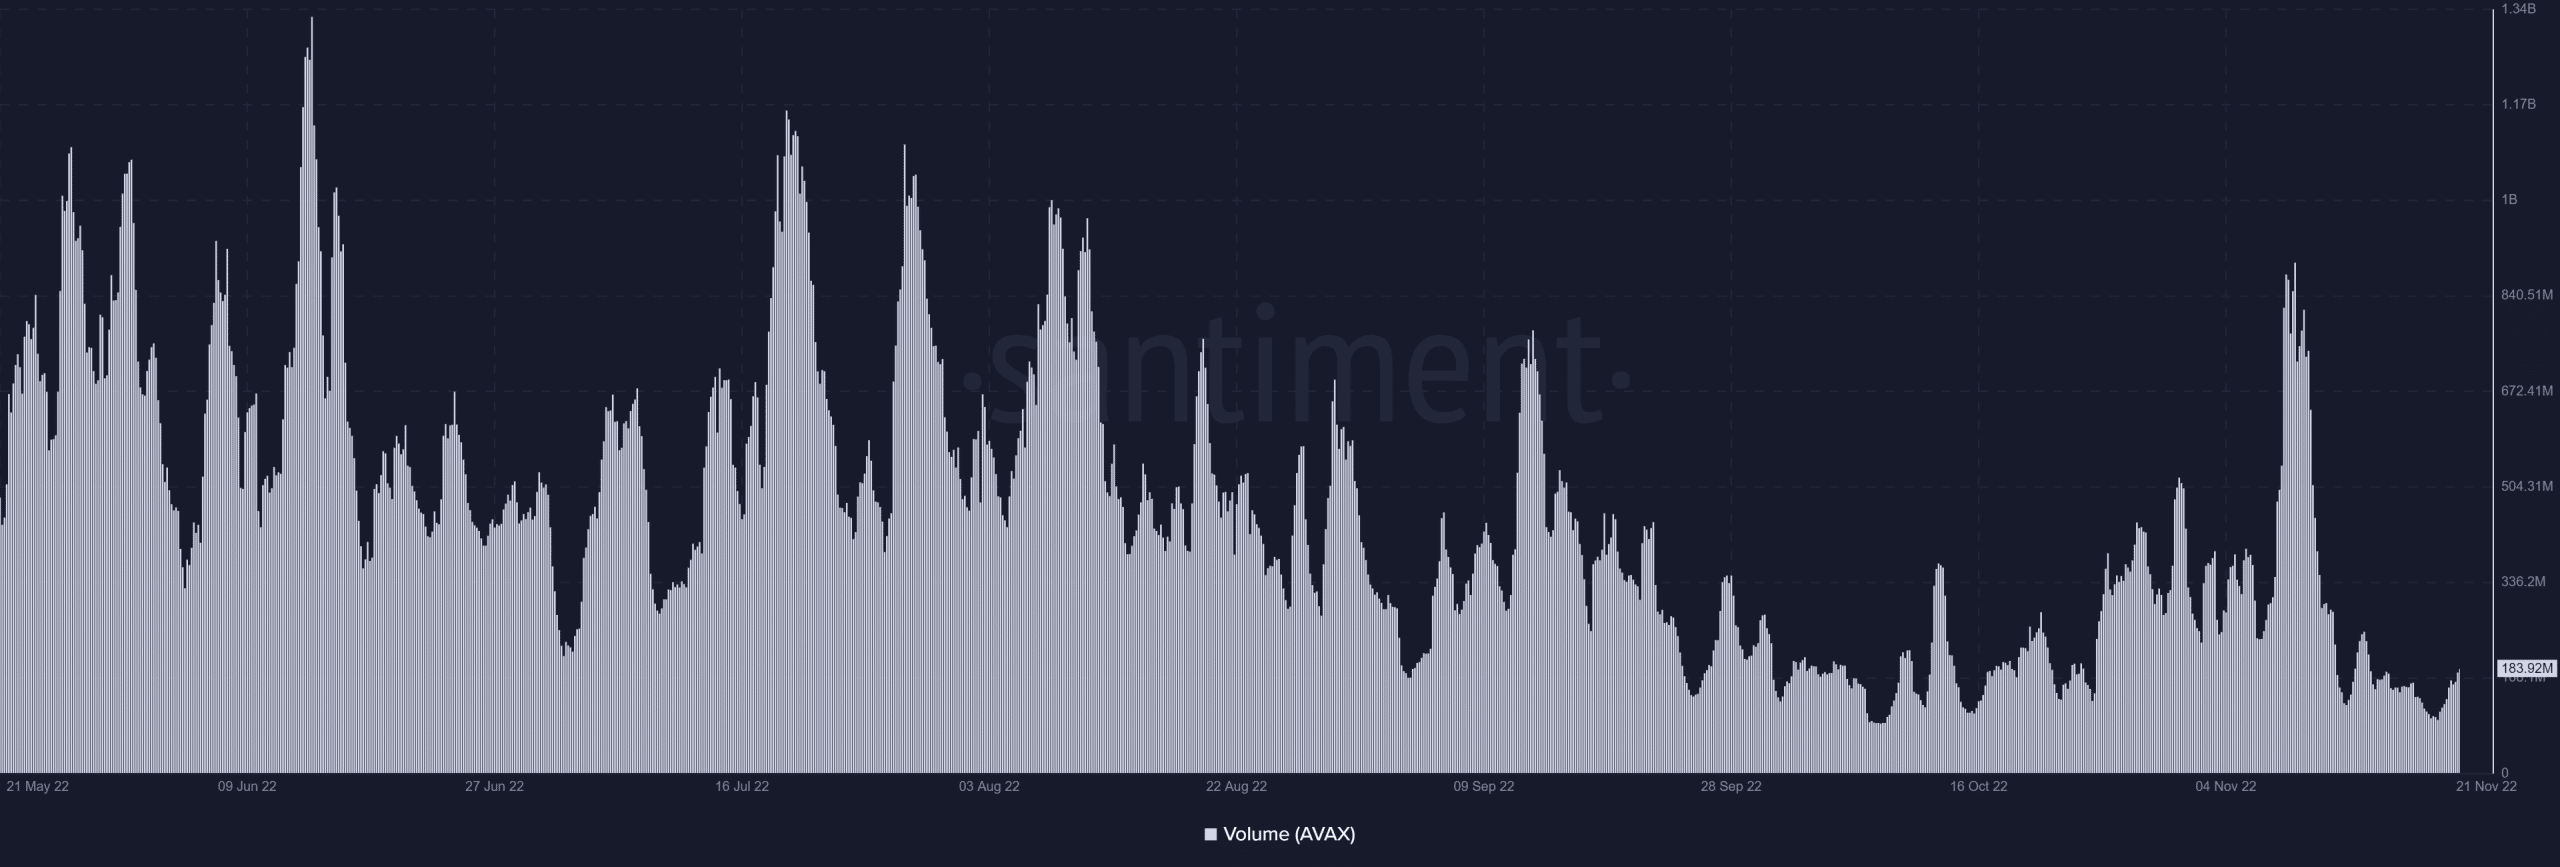
AVAX’s price has been on a downward trend in recent weeks despite the company’s strong performance in key measures. Santiment’s volume chart revealed that except for a small surge around 10 November, the metric had been underwhelming. In contrast to the transaction volume on the network, AVAX’s volume was clearly decreasing.

Source: Santiment
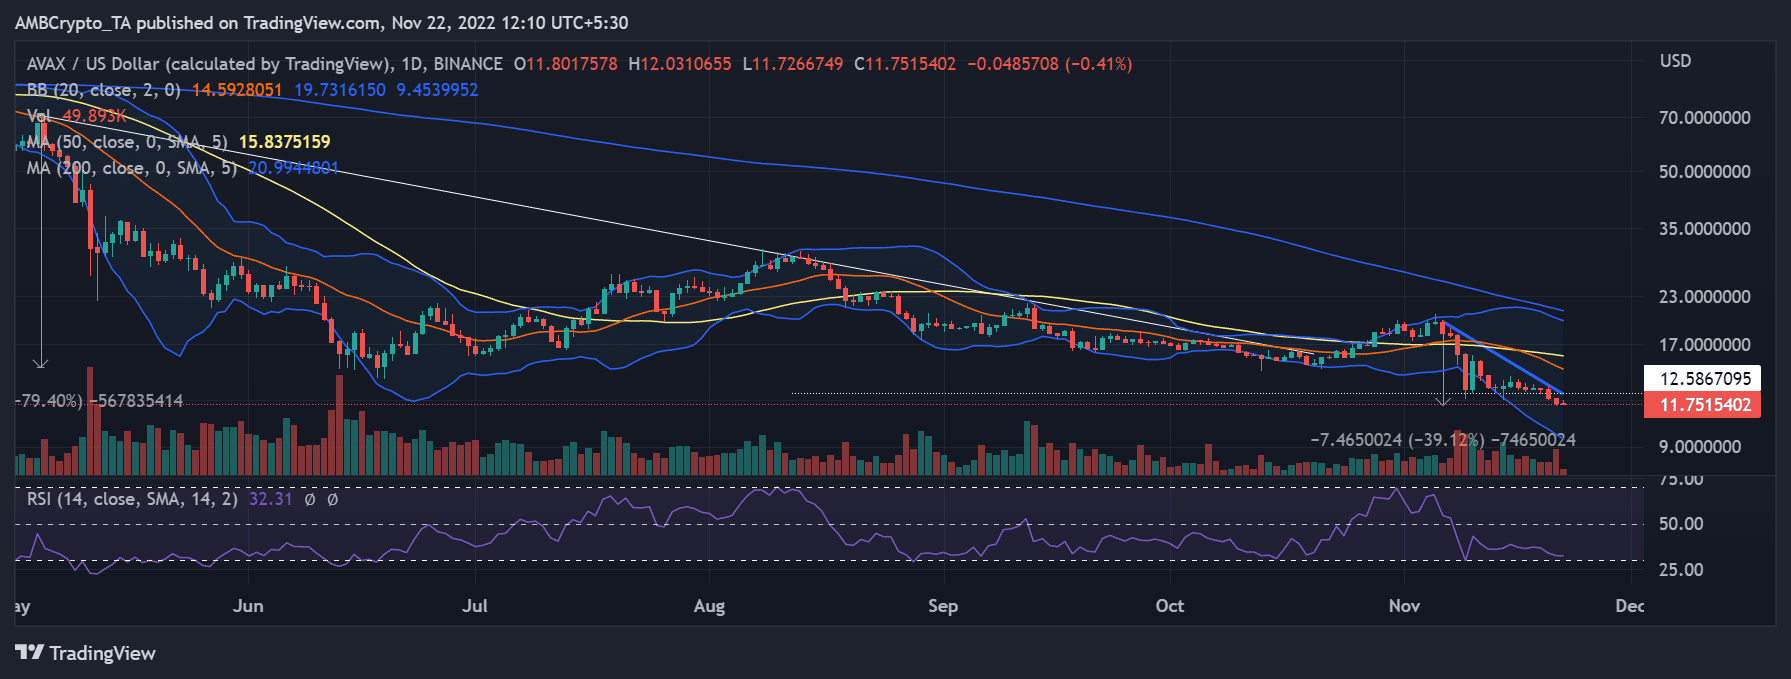
AVAX’s price action on a daily timeframe registered a clear downward trend, which was emphasized by the trend line. The price movement proceeded downward after breaking the support line that was present around the $12 area. Between $15 and $16, the 50 Moving Average (Yellow line), which was also visible above the price movement, acted as resistance.

Source: TradingView
The price range tool computation showed that AVAX’s value had decreased by over 39%. The Relative Strength Index (RSI), which stood in line with 30, also showed that the asset’s price action was poor. Furthermore, if the Bollinger Bands (BB) were to be believed, the price could go in either direction with the trend, as it depicted a high level of volatility.


