Disclaimer: The information presented does not constitute financial, investment, trading, or other types of advice and is solely the writer’s opinion
- The market structure was bearish on the 12-hour timeframe
- Combined with technical indicators, a rally seemed unlikely
Volatility is an absolute necessity for traders. Investors might dislike or fear volatility but traders, especially lower timeframe ones, tend to thrive on it. However, the crypto markets have dried up in volume in recent days as the festive season sets in.
– A 163.63x hike on the cards IF BCH hits Bitcoin’s market cap?
Bitcoin Cash formed a bearish order block and faced rejection at it multiple times in the past week. A move upward to collect liquidity from eager short sellers could jeopardize traders who are already bearishly positioned. Bitcoin also faces stiff opposition near the $17.3k mark.
Hidden bearish divergence signals the continuation of the downtrend
Source: BCH/USDT on TradingView
In early November, following the panic around the FTX implosion, Bitcoin Cash dropped from $126 to $87. Fibonacci retracement levels were plotted (yellow) based on this move. The subsequent rally from $87 was halted at the 78.6% retracement level at $117.7 on November 24.
Since then, the price has been in a downtrend. It shifted to a bearish structure after the drop from $108.9 to $106.1 on 11 December. For most of December, the Relative Strength Index (RSI) has also been beneath the neutral 50 momentum to show that bears have the upper hand.
The Chaikin Money Flow (CMF) was unable to break out past the +0.05 or -0.05 levels, and therefore did not indicate significant capital flow into or out of the market in recent weeks.
Are your BCH holdings flashing green? Check the Profit Calculator
The RSI also formed a hidden bearish divergence (orange) with the price. Given that the trend was downward, this suggested that short sellers can be interested once again.
The H12 bearish order block around $102 (marked in red) was likely to reject any bullish attempts. Therefore, a short position can be taken, with a stop-loss above $104 and targeting the $96-$97.5 region of support.
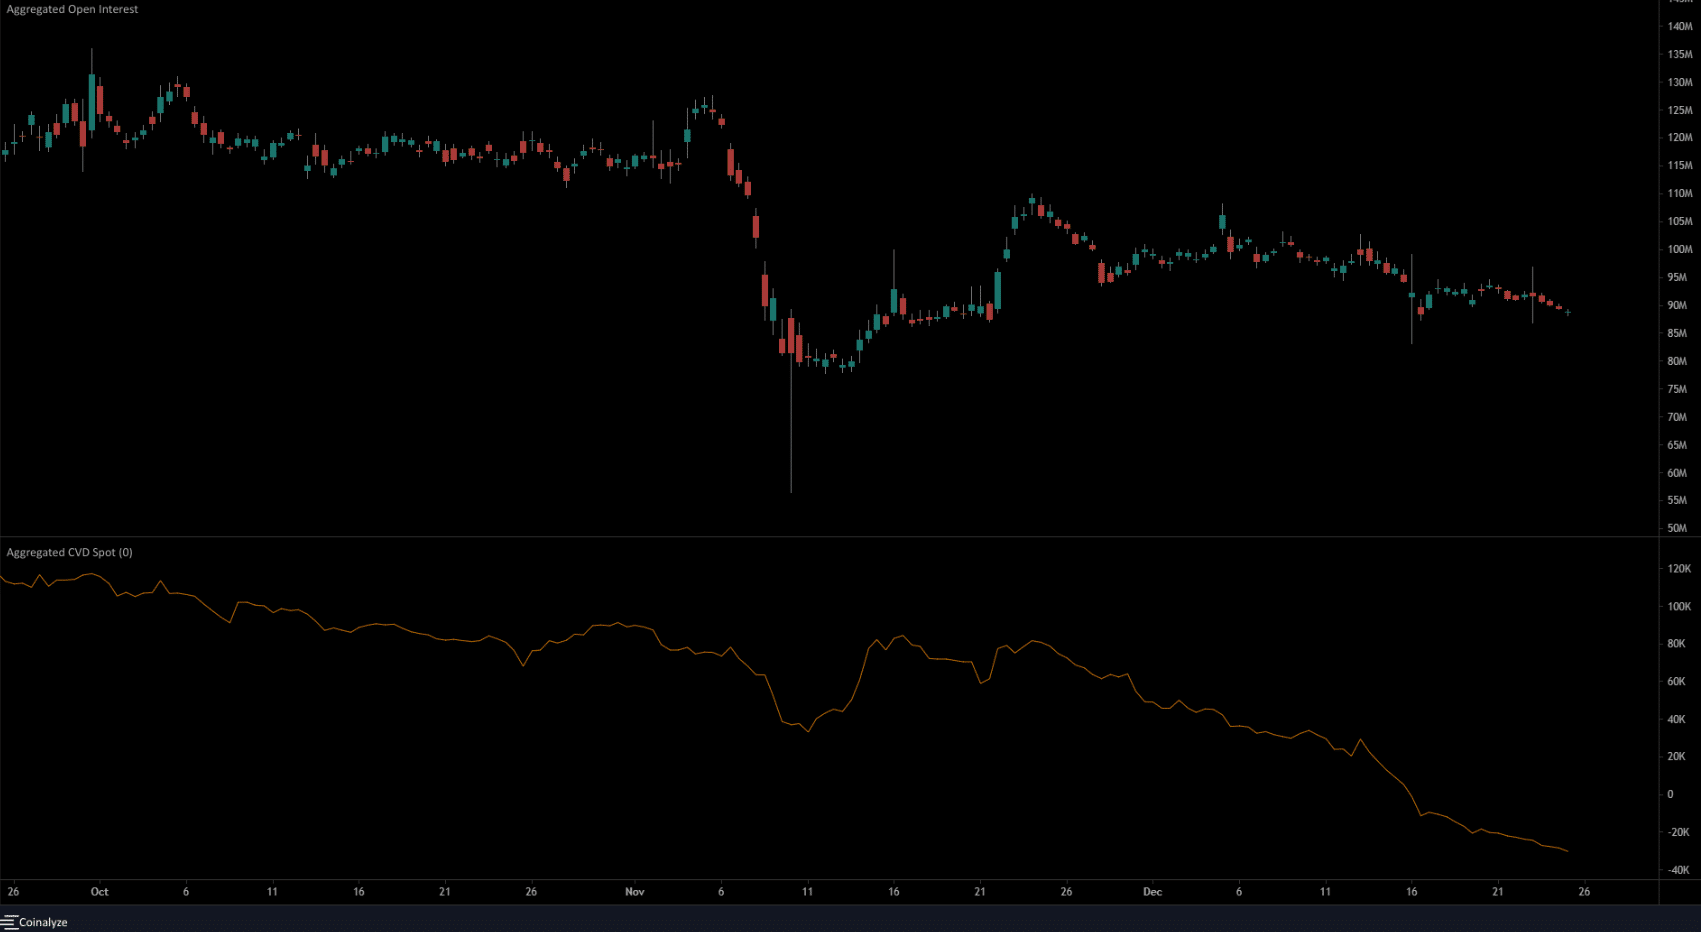
Spot Cumulative Volume Delta showed sellers were in control

Source: Coinalyze
From 13 December, both the prices and the Open Interest have been in a downtrend. This showed that long positions were discouraged and that futures market participants were bearishly biased. The spot CVD has also been in freefall since late November.
Taken together, we can infer that selling pressure was immense, and could continue to be that way heading into the new year. For Bitcoin Cash to break the bearish shackles, it will have to reclaim the $104 area as support and rise higher with increasing OI to signal bullish strength.


