The prices of most cryptocurrencies are falling, however, there are some exceptions.
SOL/USD
Solana (SOL) has lost a lot of value today, falling by 4.44%.

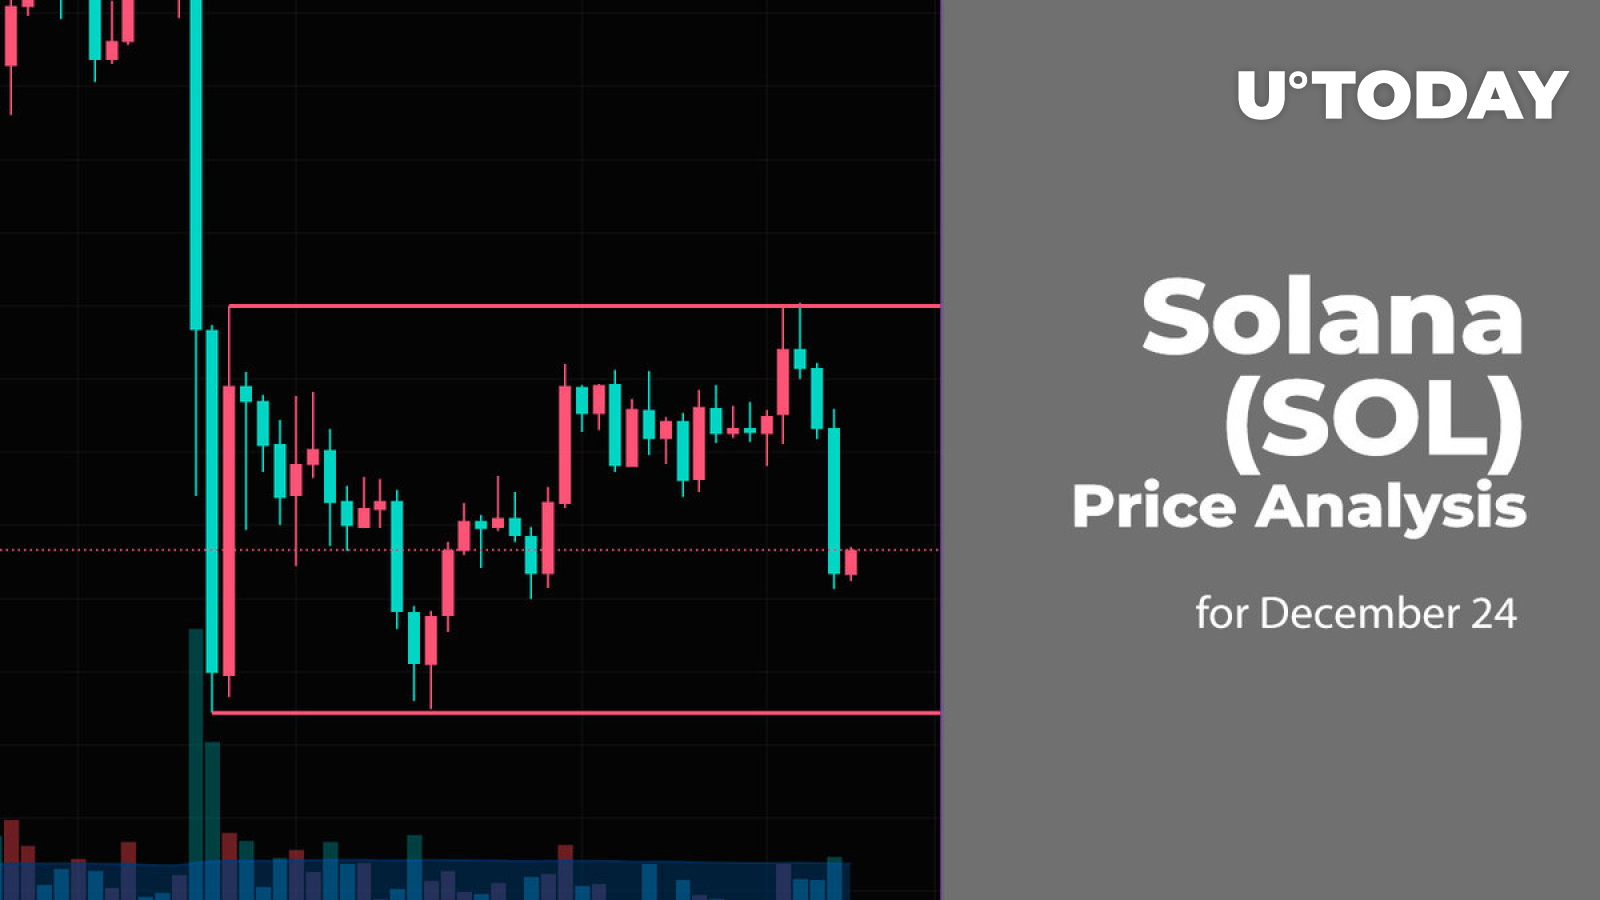
On the hourly chart, Solana (SOL) has set the support at $11.07 and the resistance at $11.40. At the moment, the rate is close to the upper level, which means that bulls might have found the local bottom.
If nothing changes, a breakout of the resistance may lead to growth to the $11.60-$11.70 zone.

On the daily chart, there are no reversal signals yet. Traders should focus on the important level at $11, a breakout of which could cause a fall to the $10.80 mark. Such a scenario is relevant until the end of the upcoming week.

On the weekly time frame, Solana (SOL) is ready to keep falling if the candle closes near or below the $11 mark. If that happens, the next stop where bulls may seize the initiative is the support at $9.10.
SOL is trading at $11.35 at press time.


