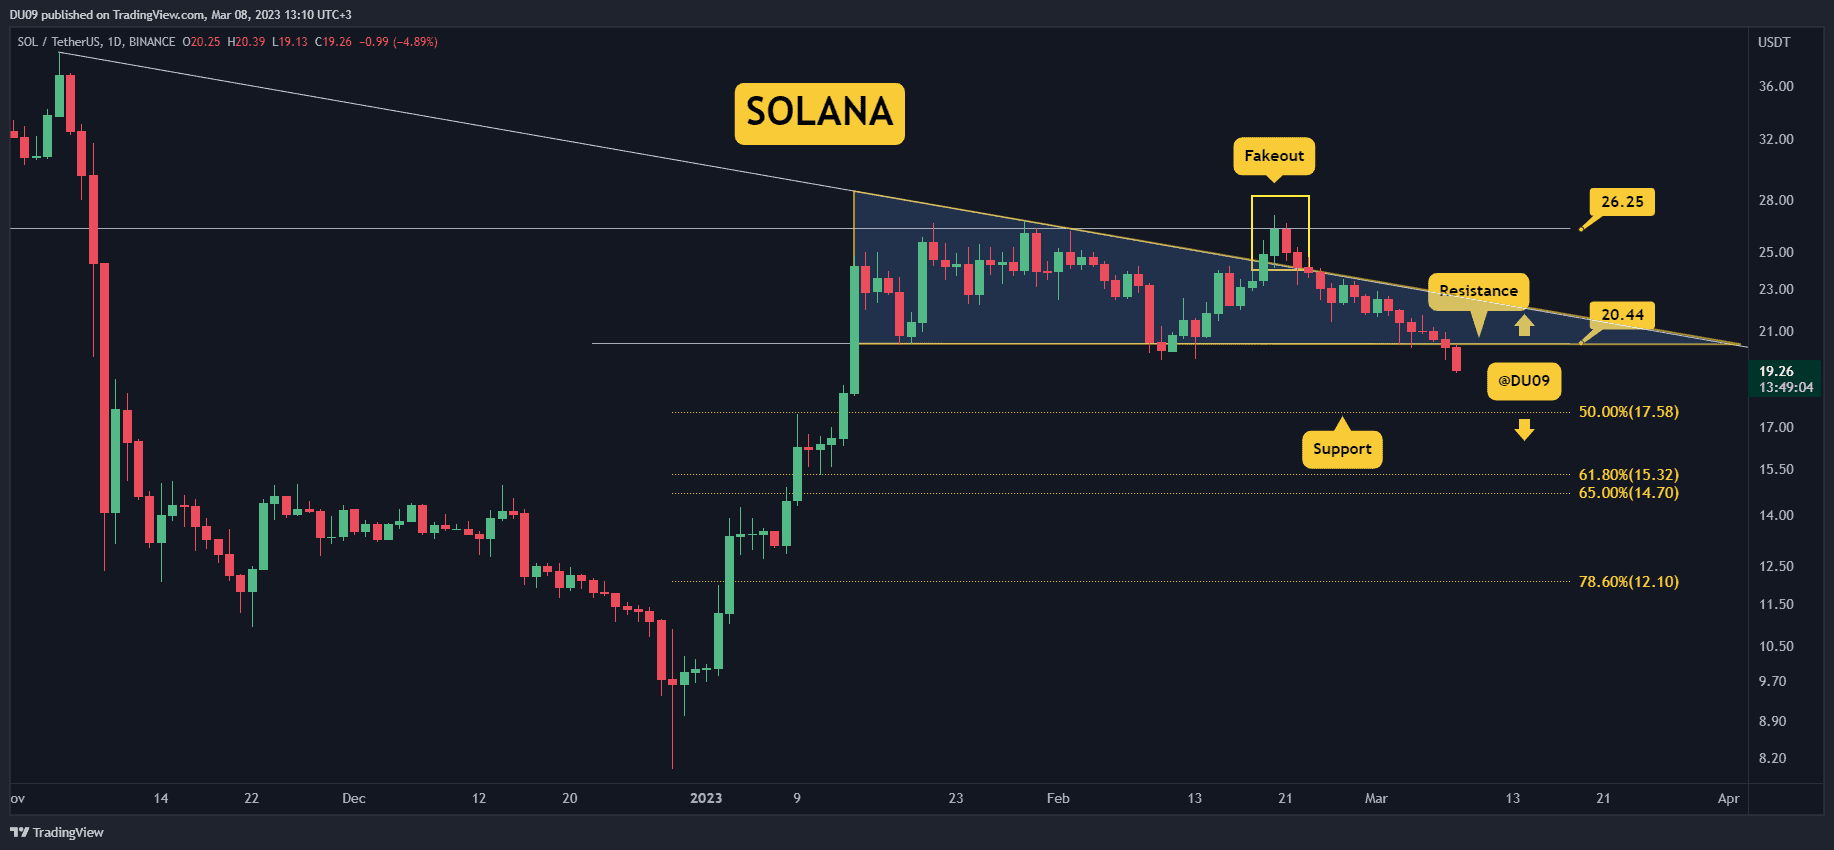
Solana lost its key support at $20 and is now accelerating down.
Solana Price Analysis
Key Support levels: $17, $15
Key Resistance levels: $20, $23
SOL failed to maintain its price within the descending triangle, and with the support at $20 turned into resistance, it’s currently in search of support. The key levels to watch are found at $17 and $15, with the latter having the highest confidence.
Trading Volume: The sustained sell volume in the past week has pushed Solana into making lower lows.
RSI: The daily RSI is quickly approaching the oversold area at under 30 points. Hopefully, buyers will become interested again.
MACD: The daily MACD is in freefall, and there are no signs that this downtrend will end at this time.
Bias
The bias for SOL is bearish.
Short-Term Prediction for SOL Price
The most likely area where Solana can stop this selloff is found at $15. The support at $17 may provide a relief bounce, but considering this momentum, it is unlikely to hold for long.
Binance Free $100 (Exclusive): Use this link to register and receive $100 free and 10% off fees on Binance Futures first month (terms).
PrimeXBT Special Offer: Use this link to register & enter POTATO50 code to receive up to $7,000 on your deposits.
Disclaimer: Information found on CryptoPotato is those of writers quoted. It does not represent the opinions of CryptoPotato on whether to buy, sell, or hold any investments. You are advised to conduct your own research before making any investment decisions. Use provided information at your own risk. See Disclaimer for more information.
Cryptocurrency charts by TradingView.


