Disclaimer: The opinions expressed by our writers are their own and do not represent the views of U.Today. The financial and market information provided on U.Today is intended for informational purposes only. U.Today is not liable for any financial losses incurred while trading cryptocurrencies. Conduct your own research by contacting financial experts before making any investment decisions. We believe that all content is accurate as of the date of publication, but certain offers mentioned may no longer be available.
Contents
- Starknet is here
- Cardano’s dominance
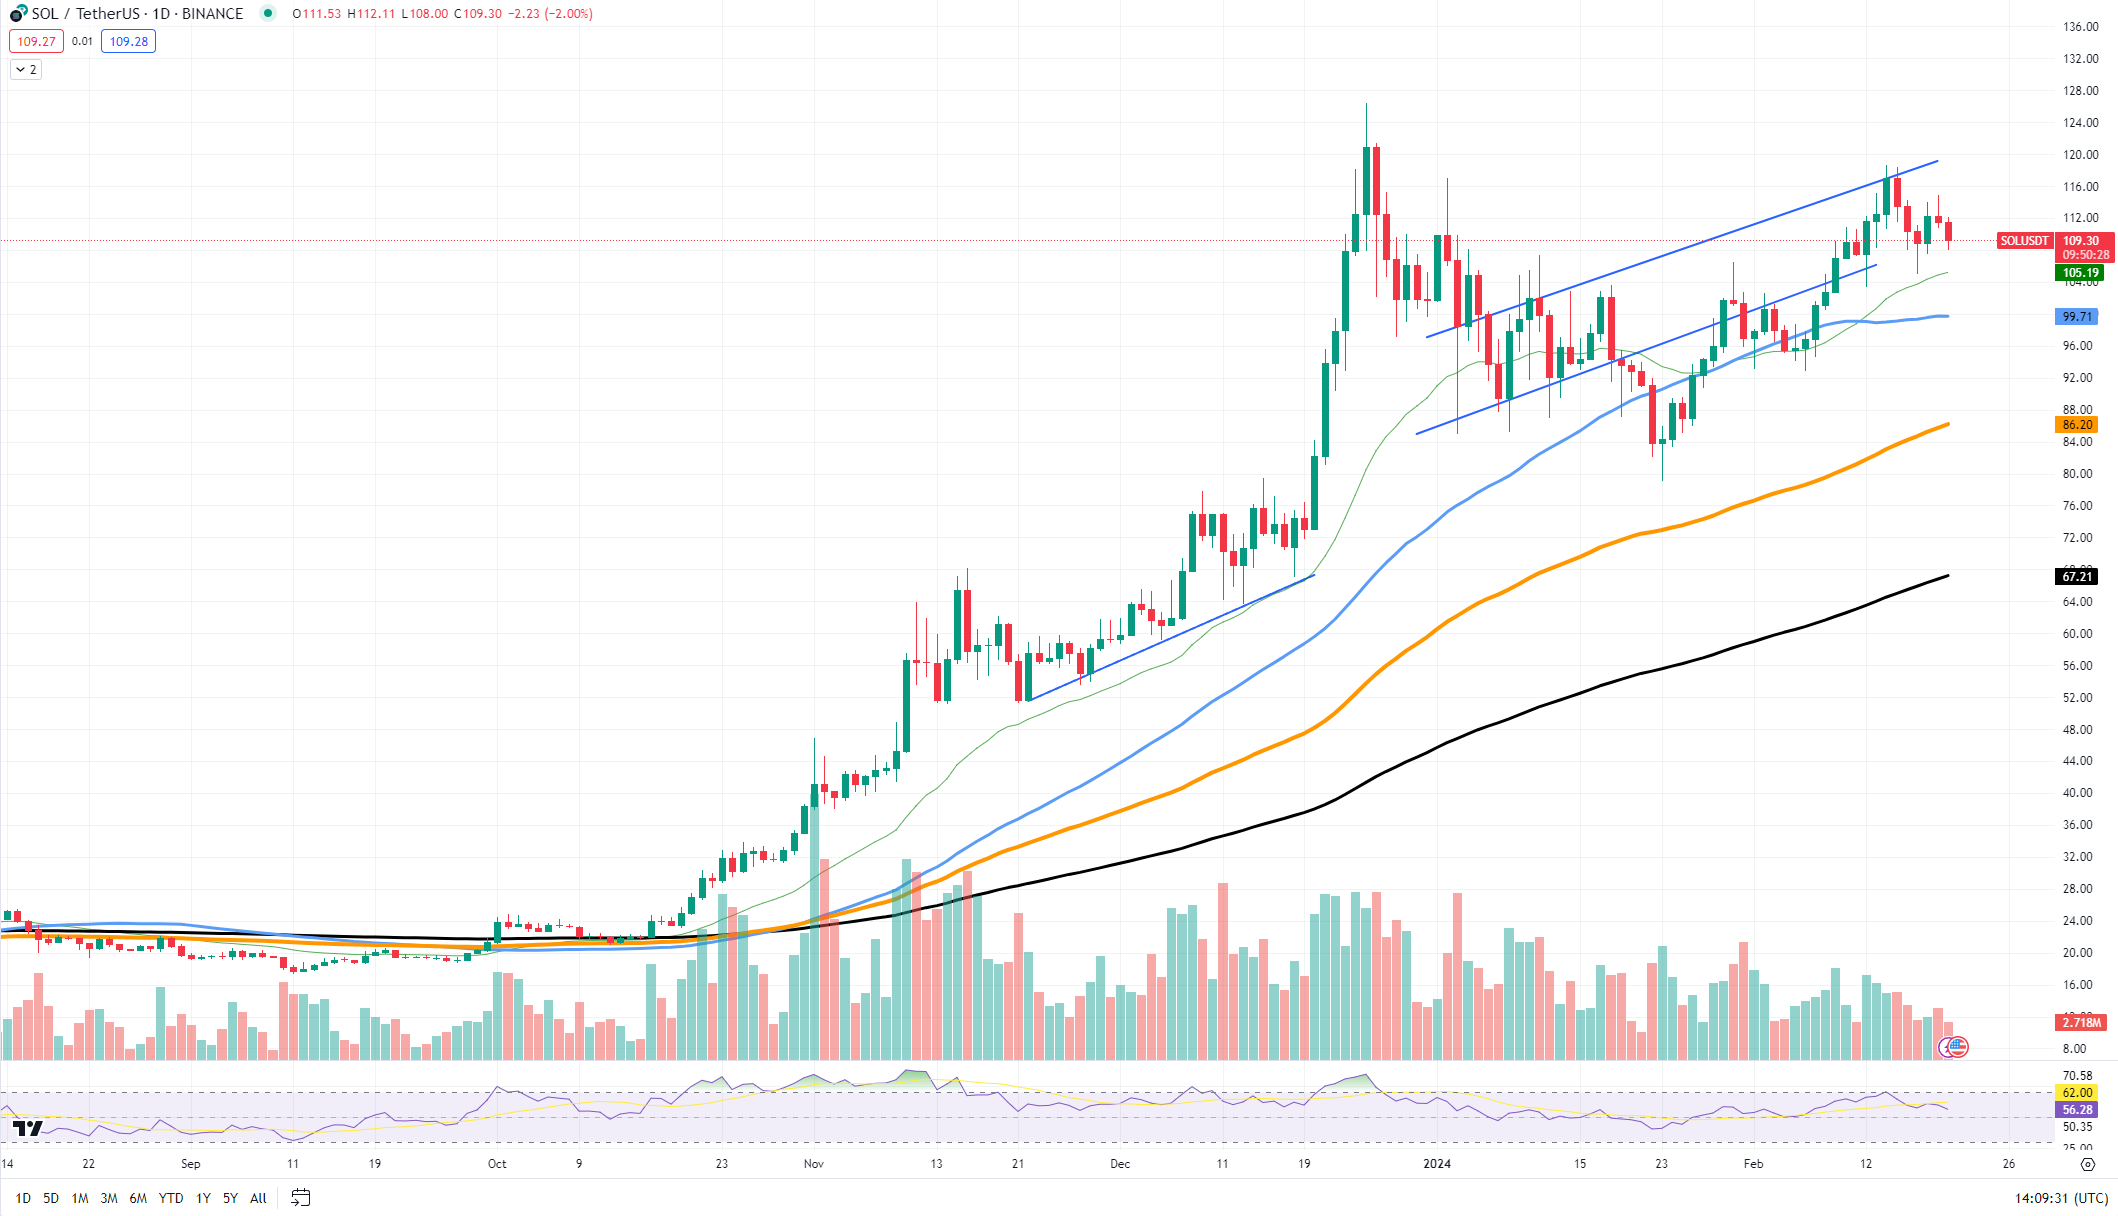
Solana has been capturing the attention of investors with its robust blockchain platform, and recent price action suggests that it may be gearing up for a move toward the $120 mark. A deep dive into its price analysis reveals that SOL is currently trading in an ascending channel, hinting at bullish sentiment among traders.
The support and resistance levels are crucial to understanding Solana’s potential trajectory. The asset has established a strong support base around the $100 level, indicated by the lower boundary of the ascending channel and reinforced by the 50-day moving average. This level has been tested multiple times, making it a significant psychological and technical stronghold for the price.

Resistance, on the other hand, can be seen near the upper trend line of the channel, which currently sits just above the $110 mark. A convincing break above this resistance could open the gates toward the $120 target. The 100-day and 200-day moving averages, currently at $88.21 and $67.23, respectively, continue to slope upwards, providing additional layers of support and affirming the long-term uptrend.
Should the bullish momentum continue, a push past the current resistance could see Solana test $120 in the foreseeable future. This would represent a significant psychological level and a new foothold for the cryptocurrency.
Starknet is here
Starknet is listed on Binance, a development that has triggered a significant surge in volatility for the asset, just as expected. Starknet is witnessing dramatic price movements that invite a close examination of its performance and future potential.
An analysis of the recent price chart for STRK reveals a remarkable spike in trading activity, with prices briefly touching a high before settling at around $3.0625. This peak, which can be attributed to the initial excitement surrounding the Binance listing, acts as the current resistance level. The sharp increase in volume that accompanied this surge is a classic indicator of heightened investor interest and market volatility.
Support levels, in the wake of this listing, appear to be forming around the $2.8624 mark, which aligns with the price just before the listing announcement. It is essential to monitor this level closely, as a sustained fall below could signal a bearish outlook, while stability above it may indicate consolidation before a potential uptrend.
However, it is important to keep in mind that any projects that airdrop a significant amount of tokens usually face significant selling pressure after market listings.
Cardano’s dominance
Cardano is contending for the crown in the altcoin market. Its trajectory has been marked by significant gains, making it one of the standout performers across the cryptocurrency landscape.
A technical analysis of ADA’s price chart reveals a compelling bullish trend. The asset has recently broken out of a consolidation pattern, with its price now hovering around the $0.6376 level. This breakout is indicative of strong buying pressure and could signal the start of a new uptrend.
The support levels for ADA are well established, with the most immediate one at the $0.5017 mark, which aligns with the 50-day moving average. This level has served as a springboard for the price in recent times, and its strength will be critical in maintaining the upward momentum. Further support is found at the $0.4446 level, near the 200-day moving average, providing a robust safety net for any potential pullbacks.
On the resistance side, the first significant level to watch is around $0.7. This price point has acted as a psychological barrier in the past and could again serve as a test for ADA’s bullish case. A sustained move above this level could open the door to higher valuations, with the next resistance possibly forming around the $0.8 to $0.9 range.


