- New demand for Ethereum now sits at a year-to-date high.
- Its DeFi and NFT sectors, however, witnessed declines in the past week.
The daily count of new addresses on Ethereum [ETH] assessed on a seven-day moving average reached a year-to-date (YTD) high of 116,000 on 14th March, according to The Block’s data dashboard.
Source: The Block
This marked a 35% increase from the 86,000 unique addresses that appeared for the first time in a transaction of the native coin in the network on 1st January.
Ethereum’s rally in new demand to a YTD high came amidst a surge in its on-chain volume. AMBCrypto found that transaction volume on the network, also assessed using a seven-day moving average, attained a YTD high of $7 billion on 11th March.
As transaction volume rallied, the average fee paid per transaction on the network also climbed. According to The Block’s data, this reached a YTD high of $25 on 11th March.

Source: The Block
The DeFi and NFT sector fails to react
Despite the recent uptick in demand for the Ethereum network, its decentralized finance (DeFi) and non-fungible token ecosystems have witnessed declines.
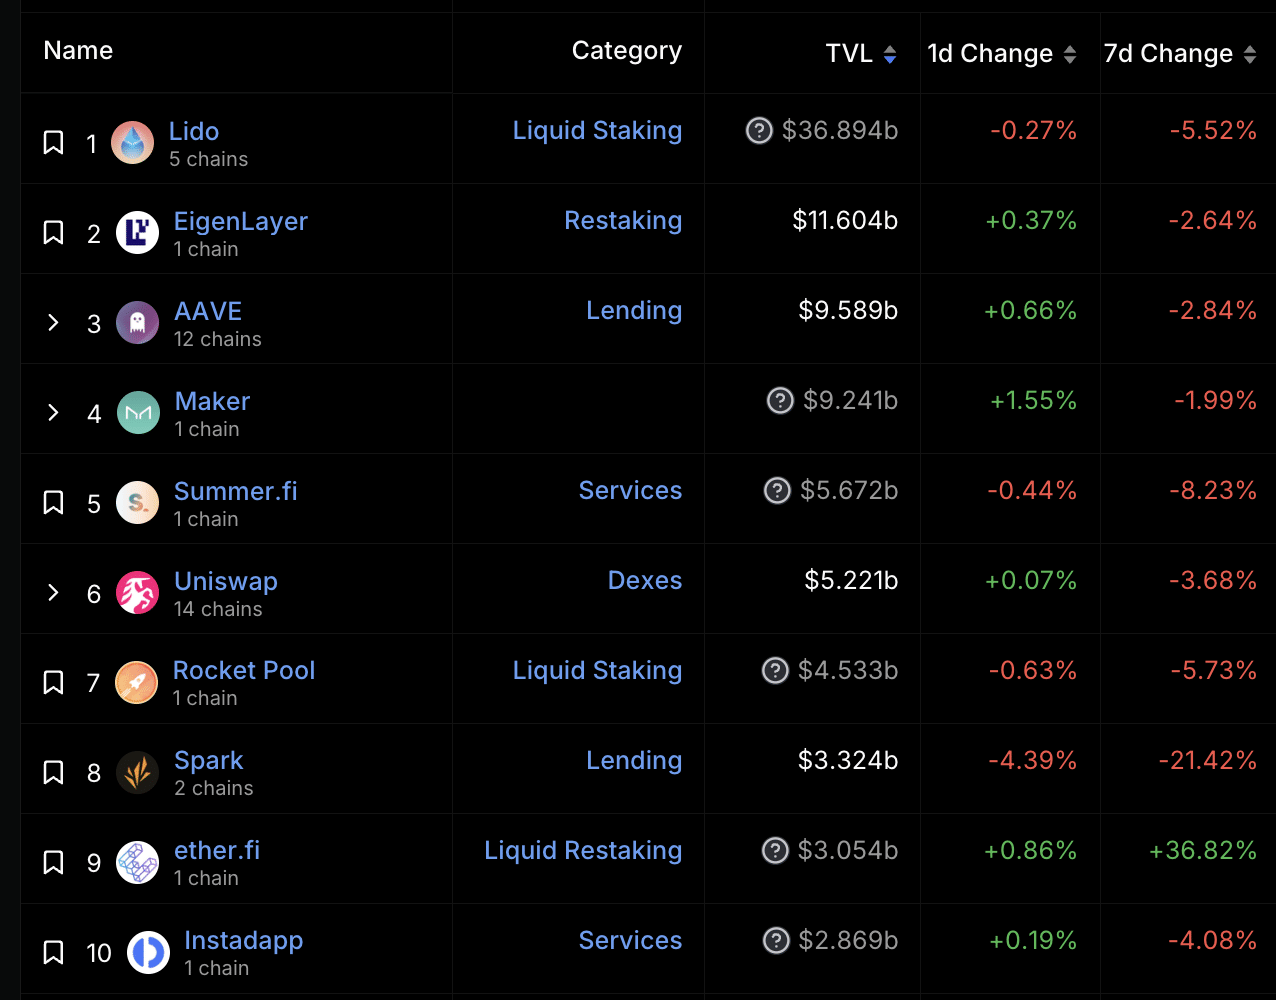
For example, the total value of assets locked (TVL) across the DeFi protocols housed within the chain declined by 5% in the last week. Per DefiLlama’s data, Ethereum’s TVL was $53.4 billion.
Out of the top 10 DeFi protocols on Ethereum, only one (ether.Fi) recorded a TVL hike in the past seven days. The rest of them witnessed a decline.

Source: DefiLlama
The network’s NFT sector recorded a 21% decrease in sales volume in the last seven days.
According to CryptoSlam’s data, despite the 90% uptick in the number of traders trading NFTs on the network during that period, the transaction count fell by 2%.
In the last seven days, 166,000 NFT transactions worth $130 million were completed on the Ethereum network.
Look before you leap
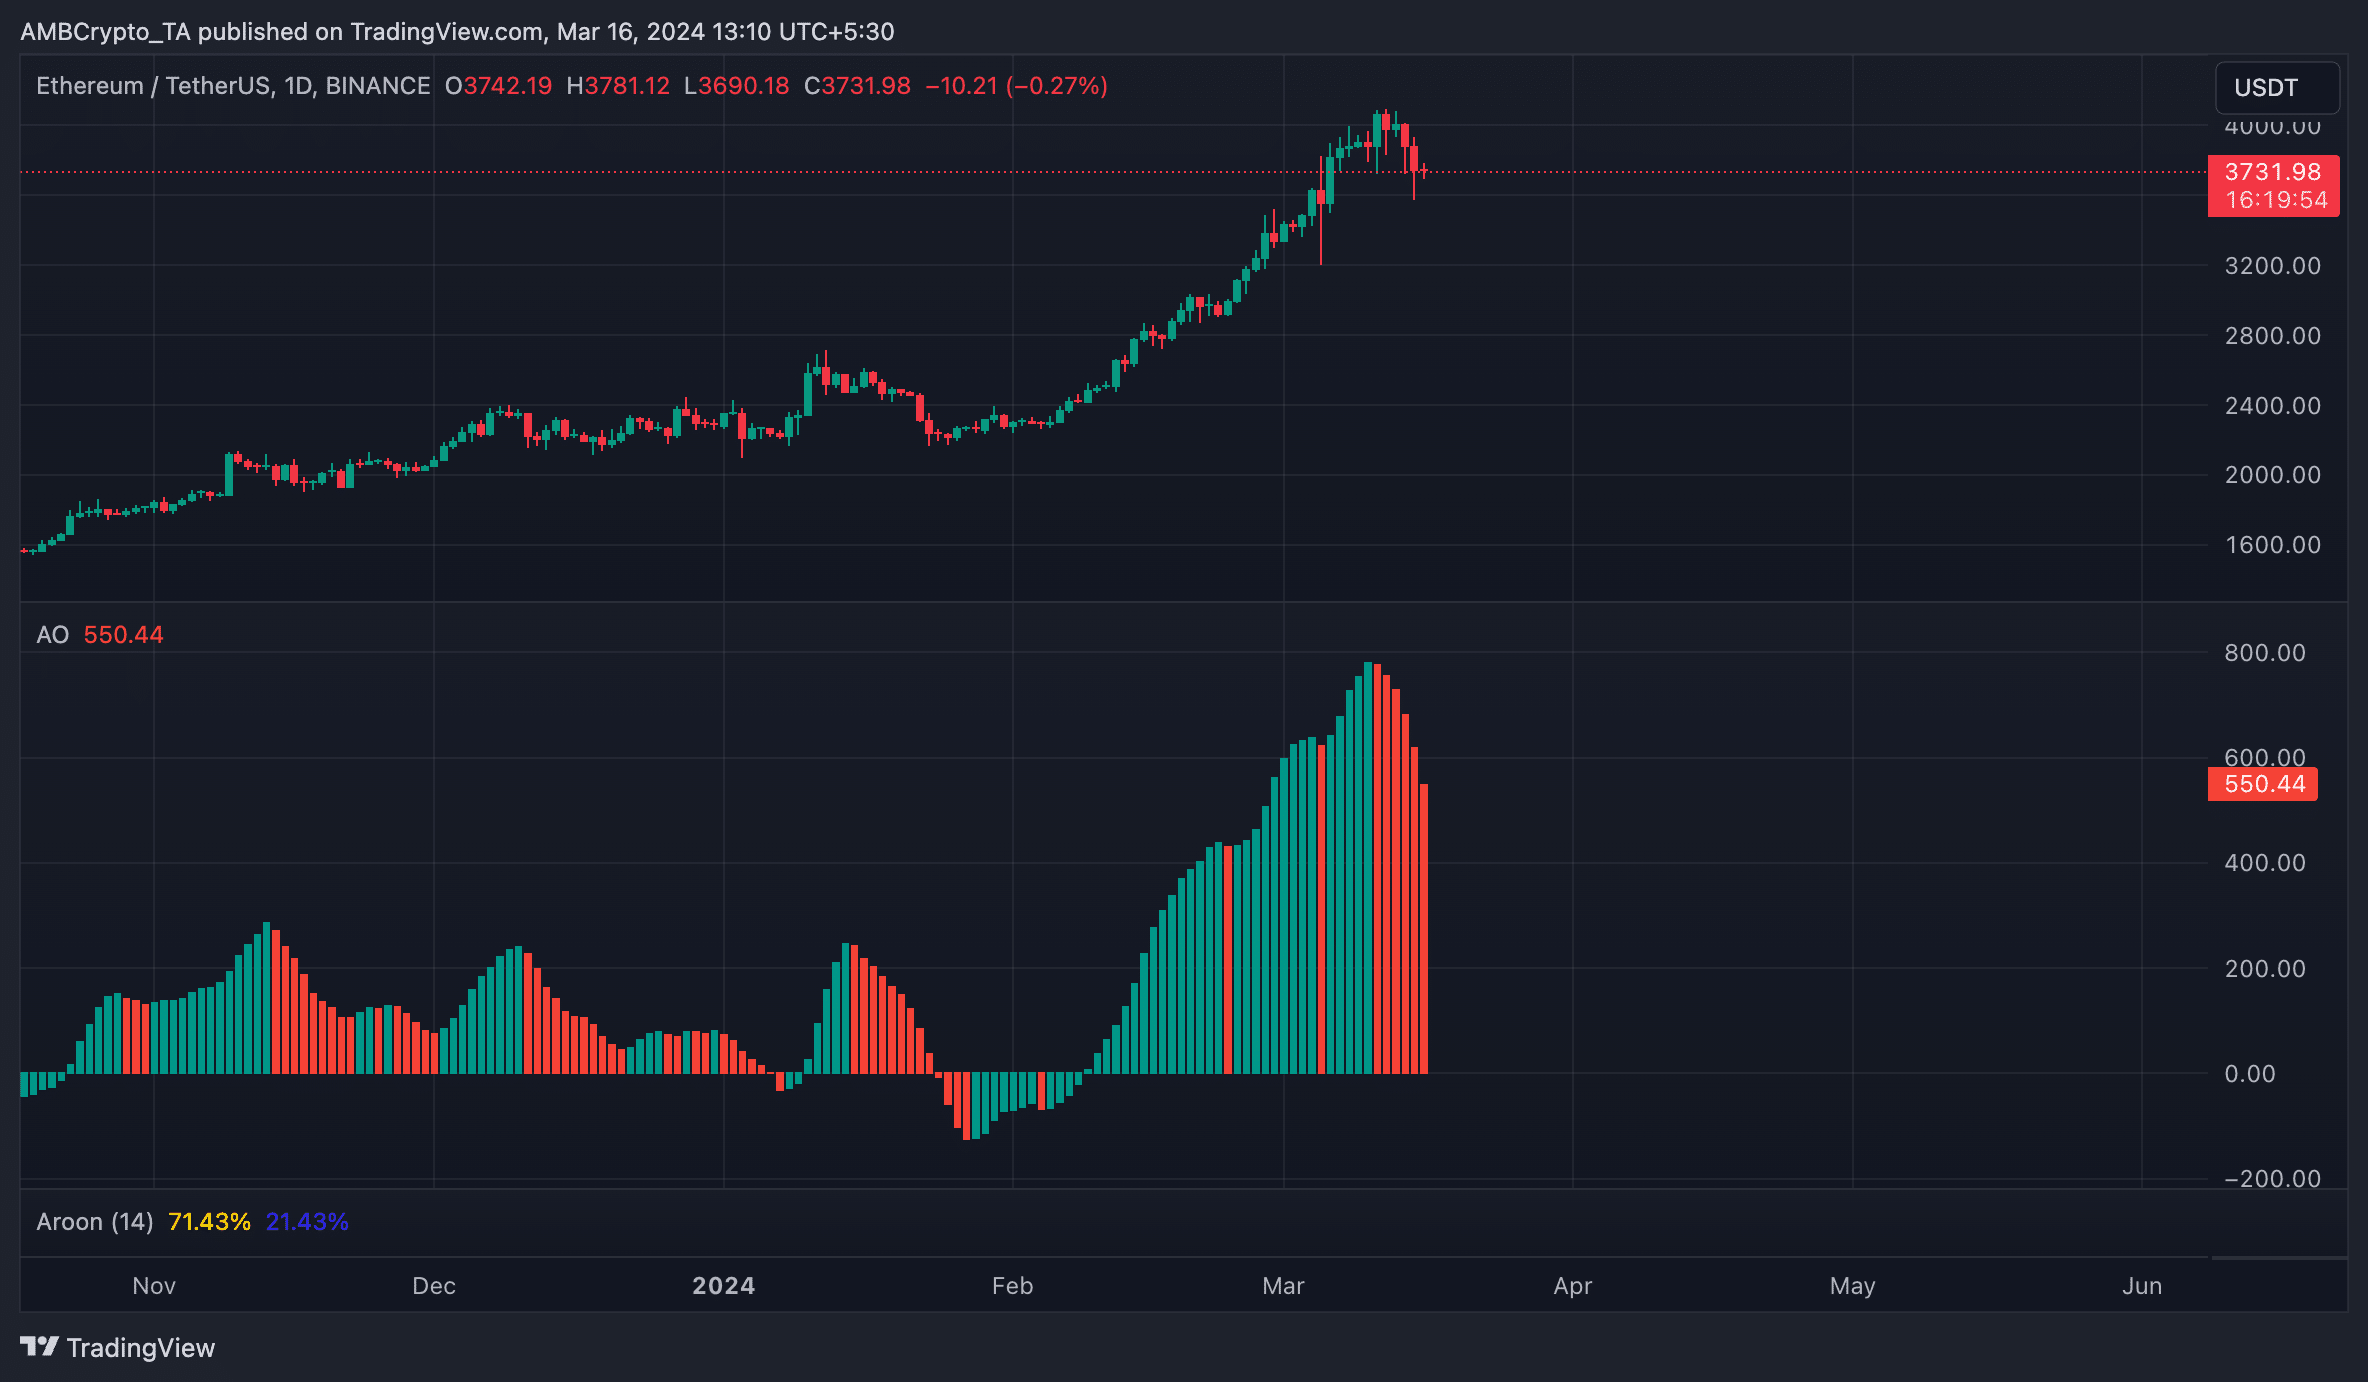
The network’s native coin ETH sold for $3,721 at press time. Per CoinMarketCap’s data, its value dropped by 6% in the last week. The decline followed a sharp fall in Bitcoin’s value on 14th March, when its value was below $68,000.
How much are 1,10,100 ETHs worth today?
An assessment of ETH’s performance on a daily chart revealed that its Awesome Oscillator (AO) indicator has posted red upward-facing histogram bars since 11th March.
An asset’s AO measures market trends and changes in momentum. When it displays red upward-facing bars, it suggests increasing negative momentum in the market. Traders often interpret this as a signal to consider selling or entering short positions.

Source: TradingView


