
- Bitcoin price closes above the $116,000 resistance, with bulls eyeing the $120,000 mark.
- Ethereum nears the critical $4,000 resistance, where a breakout could trigger further gains.
- Ripple’s XRP approaches daily resistance at $3.40, with a close above potentially fueling a rally toward record highs.
Bitcoin (BTC), Ethereum (ETH), and Ripple (XRP) prices are approaching their key resistance levels on Friday after rallying by 2%, 6% and 11%, respectively, in the previous day. This surge in the top three cryptocurrencies comes after reports emerged on Thursday that the United States President Donald Trump is set to sign an executive order that will pave the way for the inclusion of alternative assets, including crypto, in US 401(k) retirement accounts.
Bitcoin heads towards the $120,000 mark
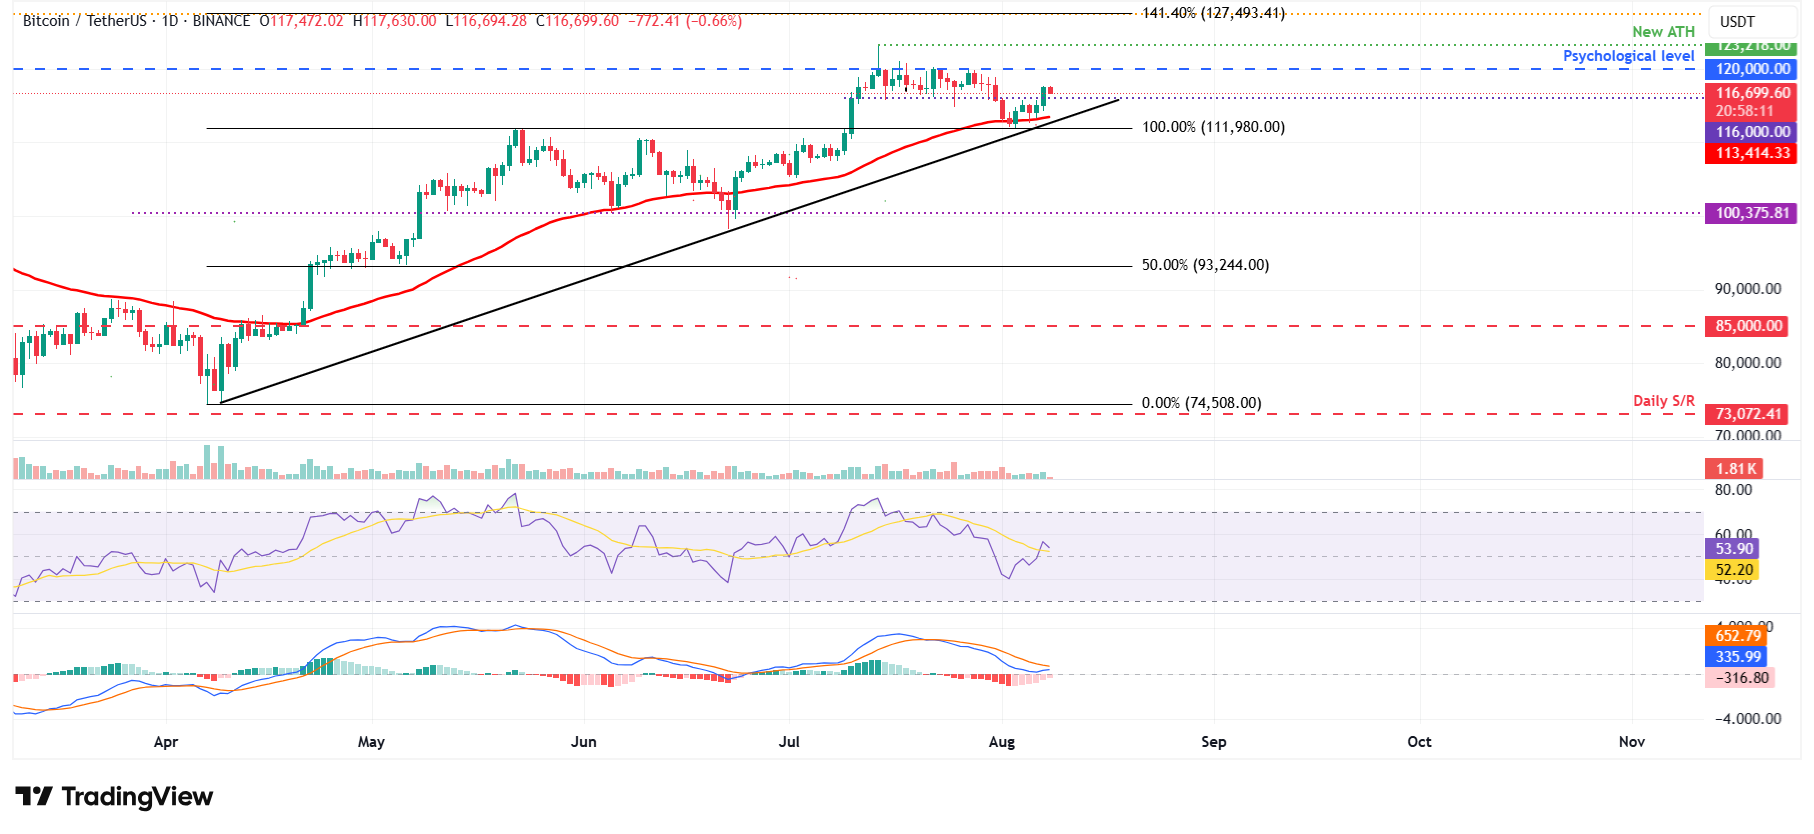
Bitcoin price closed above the $116,000 resistance level on Thursday after finding support around its 50-day Exponential Moving Average (EMA) at around $113,000 earlier this week. At the time of writing on Friday, it hovers at around $116,700.
If $116,000 holds as support, BTC could extend the rally toward its key psychological level at $120,000.
The Relative Strength Index (RSI) moved above its neutral level of 50 on Thursday and currently reads 53, indicating fading bearish momentum. For the bullish momentum to be sustained, the RSI must continue moving upward. The Moving Average Convergence Divergence (MACD) lines are nearing each other on the daily chart. The red histogram bar below the neutral level is also decreasing, indicating fading bearish momentum.
BTC/USDT daily chart
However, if BTC fails to find support around the $116,000 and closes below, it could extend the decline toward its 50-day EMA at $113,414.
Ethereum bulls aiming for levels above $4,000
Ethereum price found support around its 78.60% Fibonacci retracement level at $3,397 on Sunday and rallied over 16%, closing above the daily resistance at $3,730 on Thursday. At the time of writing on Friday, it nears its key psychological level at $4,000.
If ETH breaks and closes above the $4,000 level, it could extend the rally toward the December 9, 2021, high of $4,488.
The RSI on the daily chart reads 65, above its neutral level of 50, indicating bullish momentum. Like Bitcoin, Ethereum’s MACD lines are nearing each other on the daily chart. The red histogram bar below the neutral level is also decreasing, indicating fading bearish momentum.
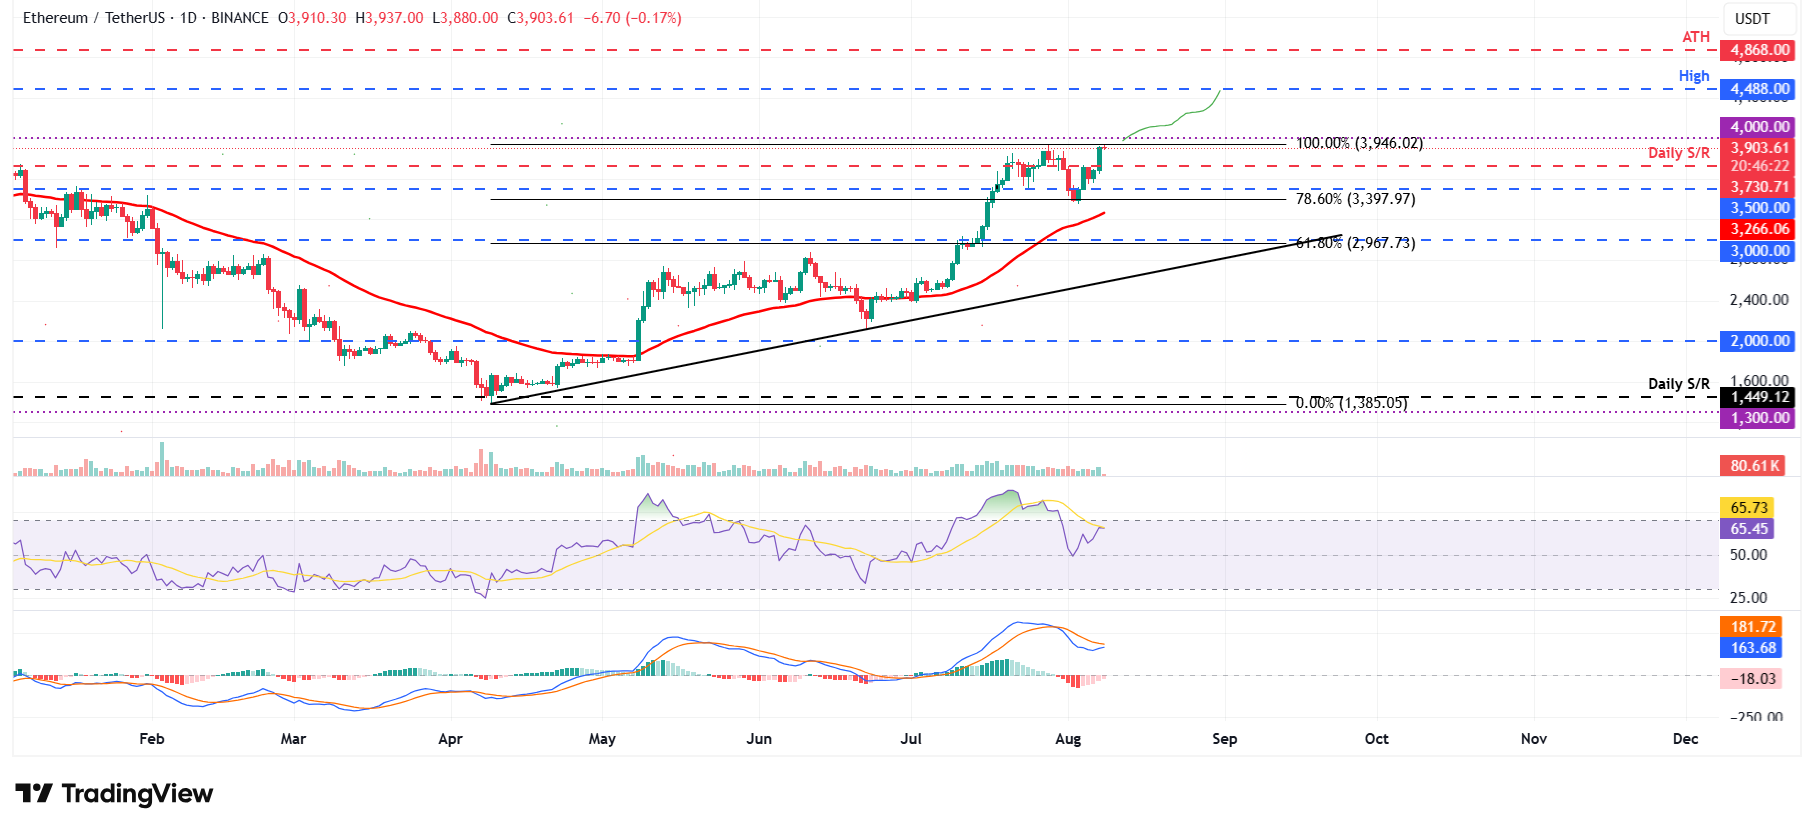
ETH/USDT daily chart
On the other hand, if ETH faces a correction, it could extend the decline to find support around its daily level at $3,730.
XRP could rally toward record high if it closes above $3.40 resistance
XRP price found support around the 50-day EMA at $2.84 on Sunday and recovered nearly 11% by Monday. This 50-day EMA roughly coincides with the daily level at $2.72 and the 50% Fibonacci level at $2.78, making it a key support zone. XRP continued its recovery mid-week, reaching a high of $3.33 on Thursday. At the time of writing on Friday, it continues its rally, approaching its key resistance at $3.40.
If XRP closes above the $3.40 resistance, it could fuel the rally toward record highs at $3.66.
The RSI on the daily chart reads 62, above its neutral level of 50 and pointing upward, indicating strong bullish momentum. Like BTC and ETH, Ripple’s MACD is also indicating a fading bearish momentum.
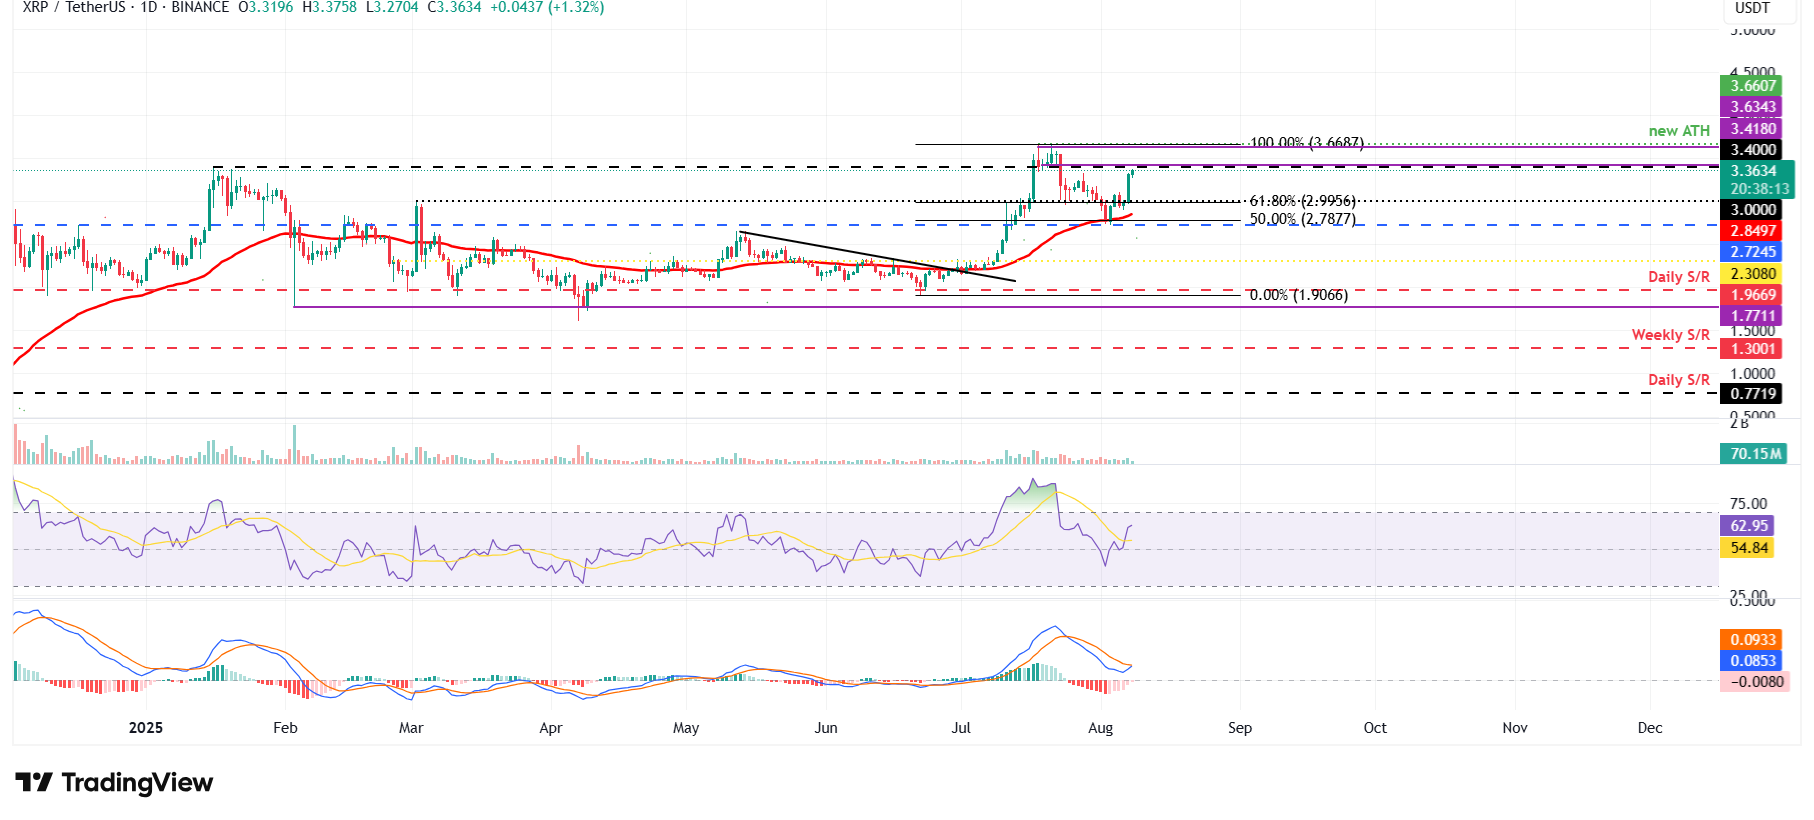
XRP/USDT daily chart
Conversely, if XRP fails to close above the $3.40 resistance and faces a correction, it could extend the pullback toward its 50-day EMA at $2.84.
Cryptocurrency metrics FAQs
Disclaimer: For information purposes only. Past performance is not indicative of future results.