

Bitcoin (BTC) and Ethereum (ETH) prices have been trading sideways within key ranges following the massive correction. Meanwhile, XRP (Ripple) recovers slightly, breaking above the key resistance zone. The top three cryptocurrencies hint at a potential short-term recovery, with momentum indicators showing fading bearish signs.
Bitcoin trades sideways within $65,700 and $72,000 range
Bitcoin price has been consolidating between $65,729 and $71,746 since February 7. As of Monday, BTC is trading in the $68,376 range.
If BTC breaks above the upper consolidation range at $71,746, it could extend the recovery toward the daily resistance at $73,072.
The Relative Strength Index (RSI) on the daily chart reads 35, rebounding from oversold levels, signaling an easing of bearish momentum. The Moving Average Convergence Divergence (MACD) showed a bullish crossover on Sunday, further supporting the recovery thesis.
On the other hand, if BTC closes below the lower consolidation level at $65,729, it could extend the decline toward the key support level at $60,000.
Ethereum faces rejection around the upper consolidation zone
Ethereum price faced rejection near the upper consolidation range at $2,149 on Sunday and declined 5.75% that day. As of Monday, ETH is trading at $1,957.
If ETH closes above the upper consolidation range at $2,149, it could extend the recovery toward the next key resistance at $2,400.
Like Bitcoin, Ethereum’s RSI and MACD indicators show fading bearish momentum, hinting at a short-term recovery thesis.

However, if ETH faces a correction, it could extend the correction toward the lower consolidation range at $1,747.
XRP breaks above the lower trendline boundary
XRP broke above the lower trendline boundary of a falling wedge on Saturday and declined slightly the next day, finding support around it. As of Monday, XRP is trading around $1.45.
If the lower trendline boundary holds as support, it could extend the recovery toward the 50-day Exponential Moving Average (EMA) at $1.73.
Like Bitcoin and Ethereum, XRP’s momentum indicators (RSI and MACD) are also signaling a recovery.
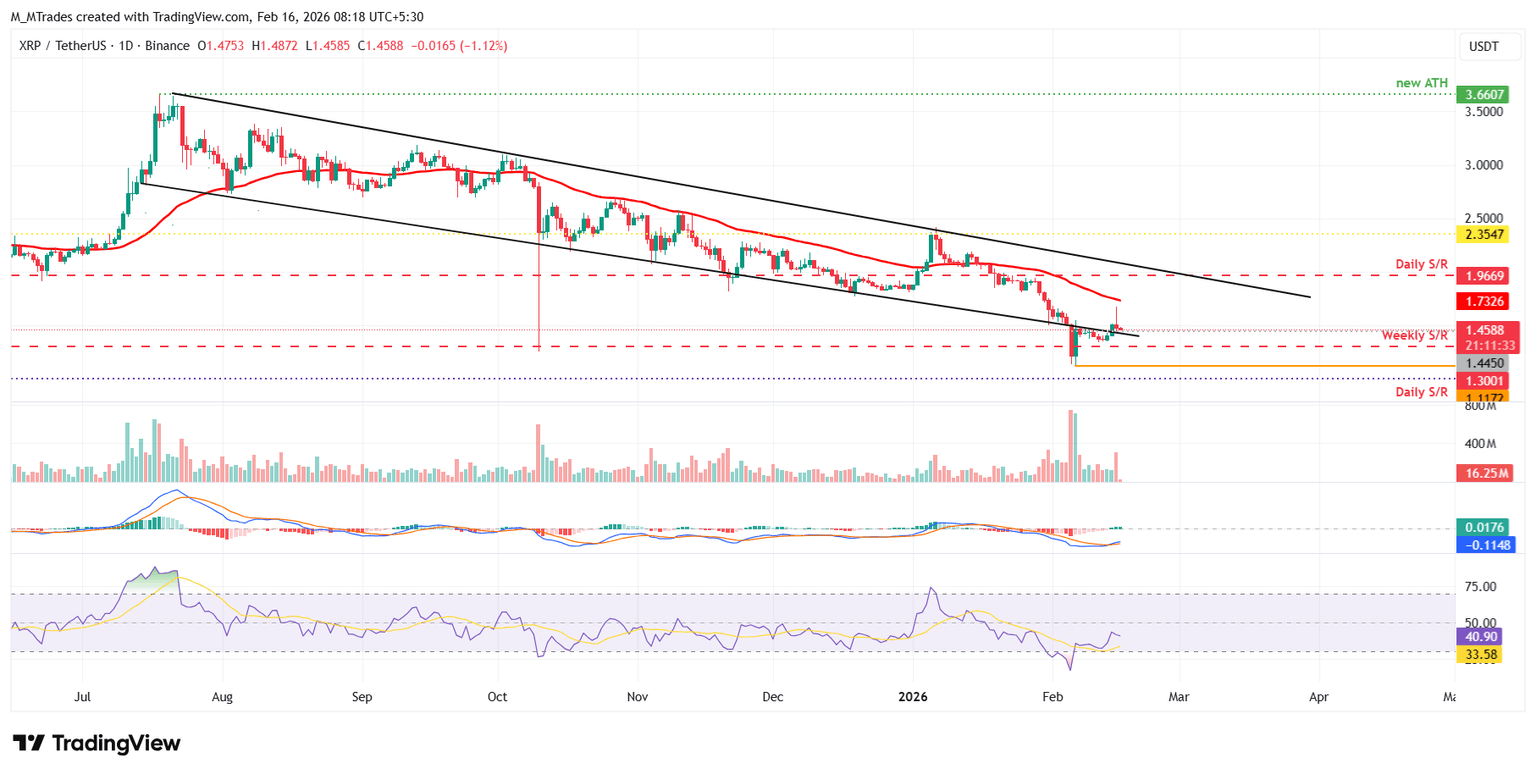
On the other hand, if XRP slips below the lower trendline, it could extend the decline toward the weekly support at $1.30.
Cryptocurrency prices FAQs


