
Author
Ahmed Balaha

Author

Share

Solana price is trading around $83, up 4.5% intraday after a brief push to $85.20, and it doesn’t matter. The rebound has failed to reclaim the 50-day SMA sitting at $86, and that failure is the only number that counts right now.
Without a clean close above it, every bounce is an exit opportunity, not a reversal signal.
Bitcoin’s recovery above $73,000 dragged SOL off its lows, but altcoin momentum here looks borrowed.
SOL technical analysis shows a textbook three-step bearish cycle – and if the pattern holds, the sideways action of the past week isn’t stabilization. It’s the coil before the next leg down, with $52 as the terminal target.
Discover: The best pre-launch token sales
Solana Price Prediction: Reclaim $86 or Slide Toward $52?
The bearish structure has been building since SOL peaked near $148 earlier this year.
Since then, the token has printed lower highs and lower lows, tracing a distribution pattern that analyst Ali Martinez has tracked across three distinct cycle instances since October 2025.
The pattern is consistent: SOL reclaims the 50-day SMA, fails to hold it as support, then enters a consolidation trap – a tight sideways range that disguises the real setup, which is a breakdown.
This cycle has already played out twice. In November 2025 and again in January 2026, SOL entered multi-week consolidation phases below the 50-day SMA before selling off hard to new local lows. In mid-March, SOL surged to $97, briefly clearing the 50-day SMA before rolling over sharply.
That was the local top. The token is now in phase three of the current cycle, grinding between $79 and $85 while the 50-day SMA holds overhead at $86.
Martinez’s read is direct: “This sideways movement isn’t stabilization. It’s the coiling of a new leg down.” The consolidation trap is deceptive precisely because it looks like support is holding. It isn’t – it’s exhaustion.
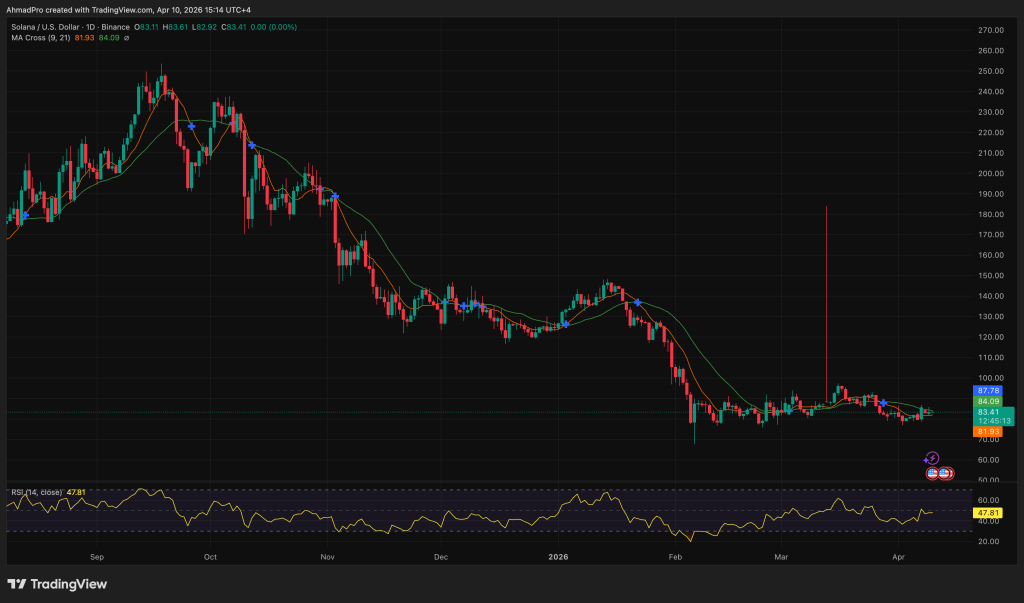
The level that actually matters is $86 – the 50-day SMA. A daily close above it with volume flips the short-term read and opens a path toward $95 and $120.
Without that, the downside scenario cascades through $75, then $67, then $60, before approaching the $52 zone that previously sparked a 2,194% rally.
That’s the high-conviction accumulation level analysts are eyeing – but getting there means absorbing every one of those intermediate breaks first.
The bull case exists. Weekly RSI shows early divergence, and there’s genuine accumulation noise in the $80–$85 range.
Discover: The best crypto to diversify your portfolio with
LiquidChain Targets Early-Mover Upside as Solana Tests Key Levels
Watching SOL grind sideways below a distribution ceiling while the broader market moves on is a particular kind of frustration – especially when the most likely resolution is another leg down. For traders sitting in SOL waiting for the $86 reclaim that keeps failing, the asymmetry argument for rotating into early-stage positioning is straightforward.
A $27 billion market cap asset delivering a 60% drawdown is a different trade than an early-stage project at ground floor pricing.
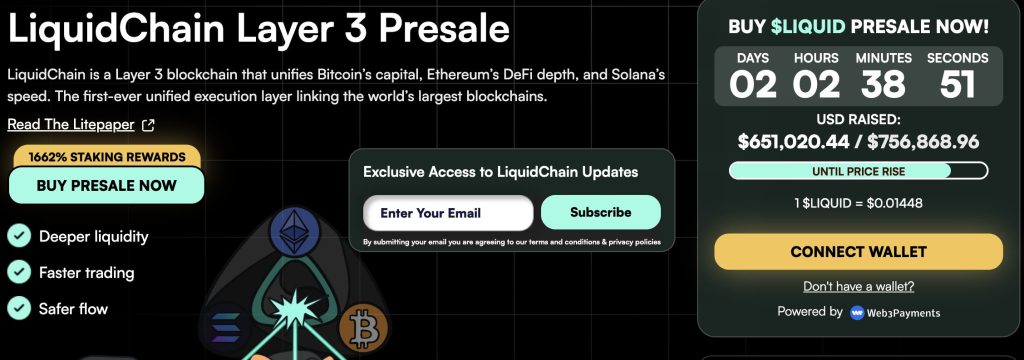
LiquidChain, a Solana Layer 3 infrastructure project targeting cross-chain throughput and settlement efficiency, is currently in presale.
Key metrics: presale price $0.031, $2.4 million raised, staking APY 127%. The core technical differentiator is a parallelized settlement layer designed to resolve Solana’s congestion bottlenecks during high-demand periods – a real problem the network has faced repeatedly.
The dynamic mirrors what’s been observed with coordinated volatility plays on established assets: when large-cap momentum stalls, early-stage infrastructure with a specific use case captures rotational capital.
That’s not a trade – that’s a thesis.
Research LiquidChain here.


