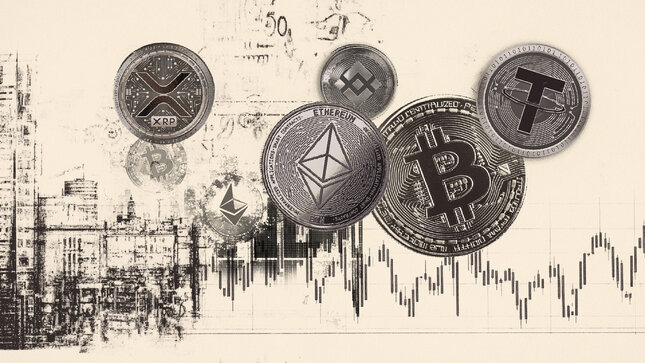

Bitcoin (BTC) is attempting to reclaim the key $64,000 resistance level on Friday after staging a modest recovery from recent declines. Ethereum (ETH) is stabilizing above $1,660 after a slight rebound, while Ripple (XRP) momentum indicators suggest weakening bearish pressure. The price action of these top three cryptocurrencies suggests a chance of a near-term recovery or a consolidation after the recent correction.
Bitcoin could extend recovery if it closes above $64,000
Bitcoin price trades at $63,390 on Friday after a slight recovery the previous day. However, BTC is maintaining a bearish bias and remains well below the 50-day, 100-day, and 200-day Exponential Moving Averages (EMAs) at roughly $71,379, $73,815, and $78,929, respectively.
The recent break and close under the prior rising trendline on June 1, which now comes in near $73,190, reinforces the notion of a market that has shifted from a trending advance into a corrective phase, while the Relative Strength Index (RSI) hovering in the low 30s hints at persistent but slightly stabilizing downside momentum rather than a clear reversal.
On the topside, initial resistance is seen at the horizontal barrier around $64,004, with stronger supply expected at the 50-day EMA near $71,379 and the former uptrend support trendline turned resistance at about $73,190, followed by the 100-day EMA at $73,815 and the 200-day EMA closer to $78,929; a sustained recovery above these clustered moving averages would be needed to ease the broader downside pressure.
On the downside, with no nearby structural price floors in play, bearish MACD and a subdued RSI reading suggest that any rebound is likely to be sold into while the pair trades beneath this heavy band of overhead resistance.
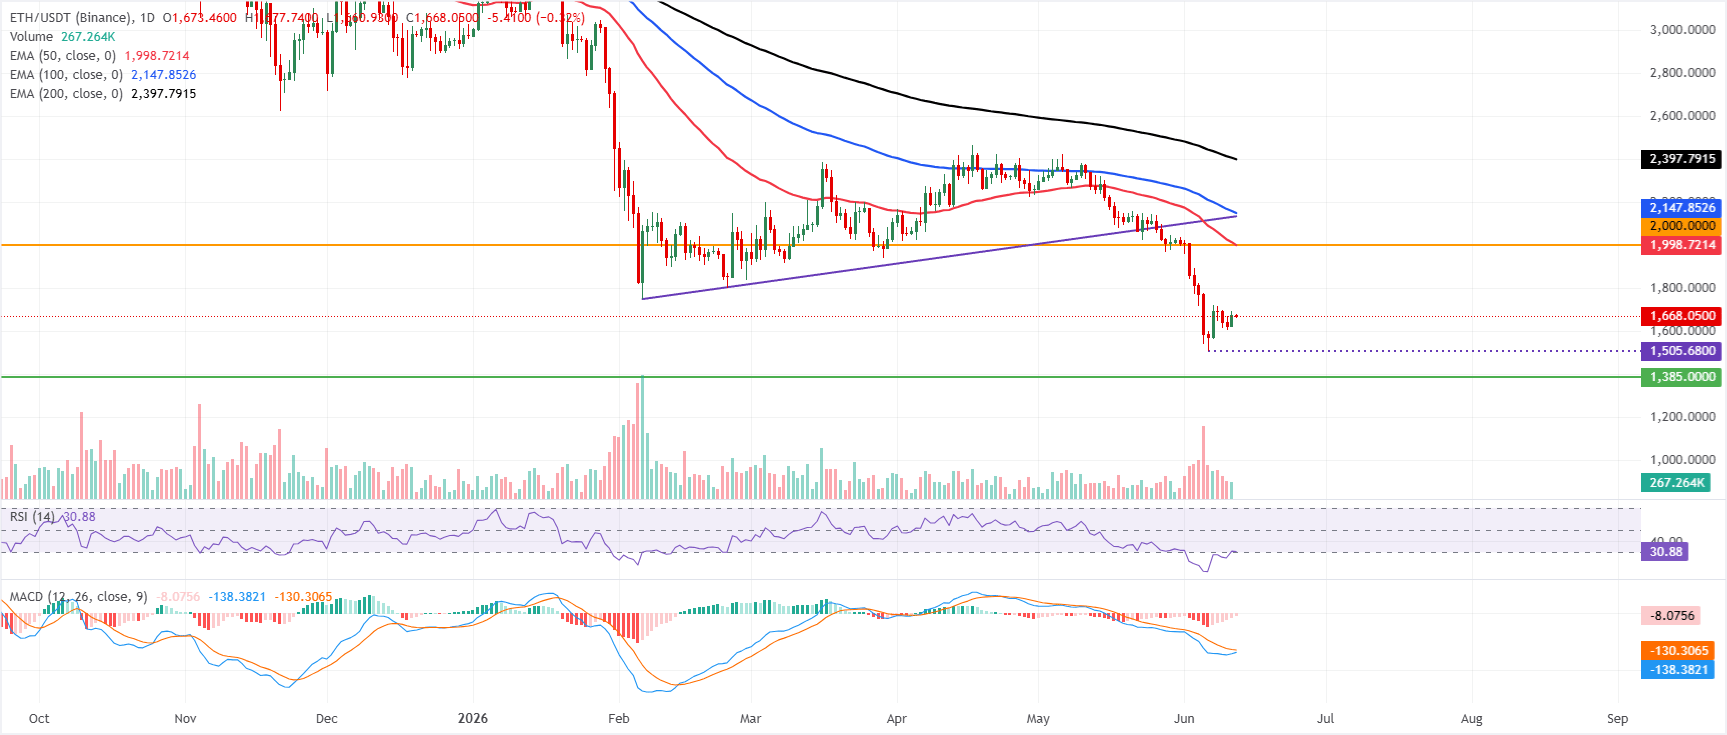
Ethereum shows early signs of a rebound
Ethereum price trades at $1,668 on Friday, maintaining a clear bearish bias as it remains locked well below the 50-day, 100-day, and 200-day EMAs, which all sit overhead as dynamic resistance. The RSI on the daily chart is just above the oversold band near 30, suggesting that selling pressure remains dominant but is somewhat stretched. At the same time, the MACD remains negative and below its signal line, hinting that downside momentum is cooling but not yet reversing.
On the topside, initial resistance is clustered around the 50-day EMA at roughly $1,998 and the nearby horizontal cap at $2,000; a sustained break above this band would be needed to ease immediate downside pressure and open the way toward the 100-day EMA near $2,147, with the 200-day EMA around $2,397 acting as a broader trend barrier.
On the downside, the next notable cushion is much lower, at the horizontal support near $1,385, where a stronger demand zone could emerge if the current bearish trend extends.
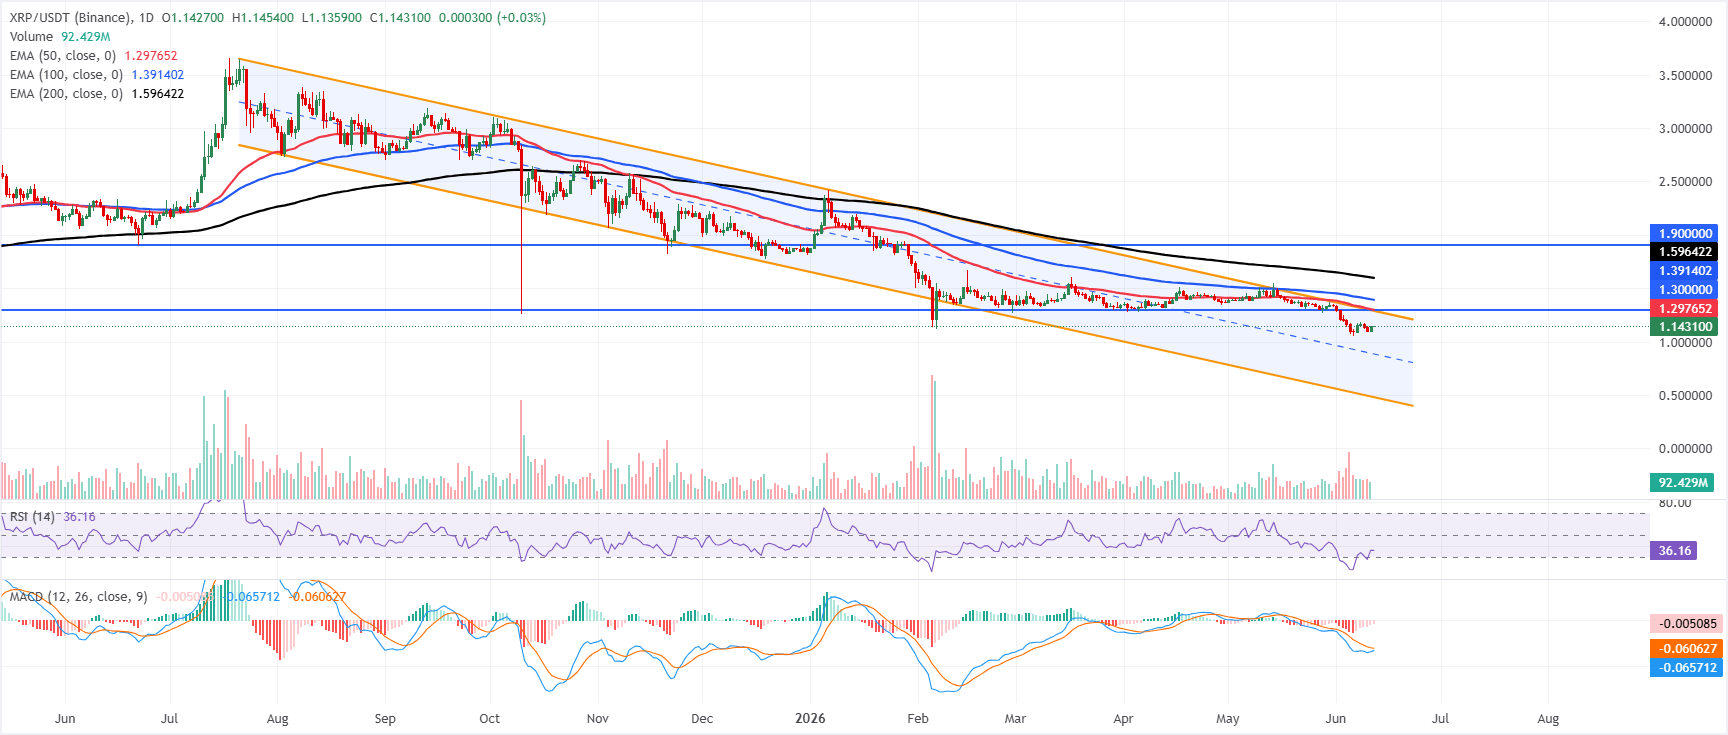
XRP momentum indicators show fading bearish strength
XRP price trades at $1.14, maintaining a bearish bias as price remains well below the short-, medium-, and long-term EMAs. The 50-day EMA at 1.29, the 100-day EMA at $1.39 and the 200-day EMA at $1.59 all sit overhead, suggesting a market still capped within a broader downtrend. The RSI has recovered from extreme oversold territory but remains subdued near 36, suggesting bearish momentum has eased without yet signaling a robust bullish reversal. The MACD indicator is negative but narrowing, pointing to waning downside pressure rather than a clear trend change.
On the topside, initial resistance is clustered around the falling channel boundary near $1.28, closely followed by the 50-day EMA at $1.29 and the horizontal barrier at $1.30, which would need to be reclaimed to alleviate immediate downside pressure. Above that, the 100-day EMA at $1.39 and the 200-day EMA at $1.59 form successive resistance layers ahead of the more distant horizontal cap at $1.90.
With no clear technical support levels defined below the current price in this dataset, any fresh declines would likely depend on how sentiment reacts to psychological handles and prior swing lows on the broader chart.
(The technical analysis of this story was written with the help of an AI tool.)
Cryptocurrency prices FAQs