
Altcoin market cap (TOTAL2) fell sharply this week, losing most of the gains from the previous one.
Despite this pullback, its bullish structure is intact on both the horizontal and diagonal levels. Will TOTAL2 be able to regain its momentum and rekindle hope for another altcoin season?
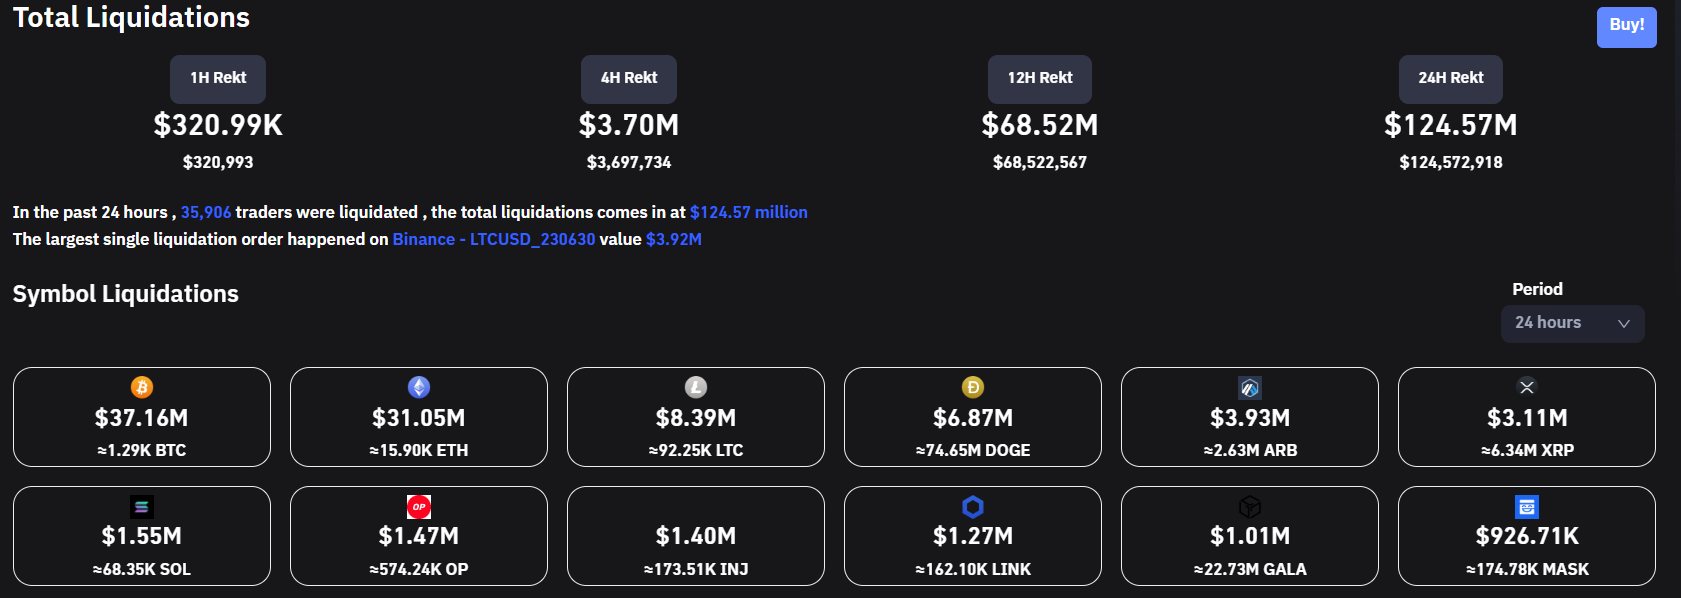
Altcoin Season 1 Stumbles On Roadblock
It looks like the recent bullish rally has come to a halt. Recent market conditions saw Bitcoin reach a new yearly high, along with Ethereum, coupled with gains across the board on altcoins. Signaling the start of a potential altcoin season as bitcoin cools off. However, a sharp correction across the board has seen over $124 million in liquidations. Could this have a big impact on a potential altcoin rally?
Altcoin market cap grew rapidly during the week of April 10-17. In doing so, it confirmed a breakout from a long-term descending resistance line that existed since the all-time high and a horizontal resistance area at $605 billion.
While TOTAL2 was trading below these levels, the trend was considered bearish. However, after their move up, it is possible that the bulls regained the lead, and a new bullish reversal is triggered. Both the previous resistance line and the $605 area are now expected to act as support.

Apart from price action, the weekly Relative Strength Index (RSI) is also providing a bullish reading. An upward trend and a reading above 50 indicates a bull market is underway. The indicator moved above 50 in early March (green icon).
The Relative Strength Index (RSI) is a momentum indicator that evaluates the speed and magnitude of an asset’s recent price changes, providing insight into overvalued or undervalued conditions. Traders take advantage of the RSI to make informed decisions on whether to buy or sell these assets, based on their assessment of the price momentum of cryptos.
If the rise continues, the next resistance lies at $916B.
Technical analysis from the daily time frame aligns with readings from the weekly. The price is currently retesting the key horizontal support area at $610 billion on the daily time frame.
Furthermore, it is bouncing off the support line of the ascending parallel channel. When price moves in such channels, multiple touches of both resistance and support lines are to be expected.
Since the price is now trading above the midline of the channel, it is expected to move towards the resistance line. The resistance line of the channel is at the average value of $720 billion.

Despite these bullish readings, a close below the $605B support area could trigger a sharp decline towards the support line of the channel at $560B.
For the latest crypto market analysis from BeInCrypto, click here.
disclaimer
In line with Trust Project guidelines, this price analysis article is for informational purposes only and should not be considered financial or investment advice. BeInCrypto is committed to accurate, unbiased reporting, but market conditions are subject to change without notice. Always do your research and seek professional advice before making any financial decisions.